Create an Organization Chart in MOSS 2007 Using a Contacts List
⚠️ This was originally posted on March 26, 2011. The information may be outdated!
Note: This article was originally posted on NothingButSharePoint.com, but some of the code snippets were unescaped when it was published, so I decided to post it on my own blog with the correct code snippets.
I was recently tasked with finding a way to maintain an org chart for my department. If this were a single-use resource that didn’t need to be updated frequently, I would have chosen to create it in a program such as Visio or Adobe Illustrator (even PowerPoint would work well with its SmartArt capabilities). However, this is something we want to be as maintenance-free as possible so we aren’t rebuilding it as people come and go.
The department’s operations team already maintains a list of everyone in the department by using a SharePoint Contacts list, so we can pull data from that and build the org chart dynamically. This method does not require any custom code or web parts, so there’s no need to deploy anything on the server!

Before I go any further, I want to point out the benefits of maintaining a department contact list on SharePoint (rather than relying on distribution lists and looking people up on their MySite page every time you need a phone number). If your department doesn’t do this already, consider these benefits:
- Everyone in the department has a central place they can bookmark to quickly look for someone’s contact information (email, work phone, mobile phone, etc.)
- The list can be printed if employees want to have a hard copy of all department personnel
- The list is easy to maintain if it is incorporated with the current on-boarding workflow that the operations team manages
- Information in the list can be used for “fun” projects like listing upcoming birthdays or anniversaries
- Information in the list can be used for practical projects like this org chart or a “meet the team” page for site visitors
I also recommend this series of articles that explains how the XSLT works in SharePoint. It’s not required reading for this post, but it will help explain why we’re doing some of the things that make the org chart work.
A Synergy of Web Technologies
The org chart in this example uses a combination of CSS, jQuery, Google Charts, and XSLT to create the final product. The scripts that I used can be found here:
- Google Charts – http://code.google.com/apis/visualization/documentation/gallery/orgchart.html
- jQuery – http://jquery.com/
- Nested List to Google Org Chart plugin – http://plugins.jquery.com/project/nested-list-to-google-org-chart
For now we can load jQuery from Google’s CDN. I also decided to simply load the Google Charts API directly from Google’s web site. For production it might be better to copy the scripts into a document library on your SharePoint site and load them that way.
The Nested List to Google Org Chart plugin is not hosted anywhere, so that script must be stored somewhere on SharePoint. I have a document library called “webresources” that I use to house all of the centralized style sheets, images, and scripts I use for our department’s SharePoint site, so I uploaded the jQuery plugin here. I also created an “orgchart.css” style sheet and uploaded it here as well (at this point it doesn’t have any styles defined, but I may decide to customize the look and feel of the org chart in the future).
Now that the resources are taken care of, it’s time to start building!
Setting Up the Contacts List
The Contacts list has several columns out of the box, but we’ll need to create at least two additional columns: Department (or Team—this will be displayed on the org chart so viewers can easily see which team or sub-department everyone belongs to) and Supervisor (make this a “Person or Group” column). I also recommend changing as many of the default columns to a “Person or Group” column type as possible. This will ensure that they show the latest information pulled from Active Directory.
To change the default columns to a “Person or Group” column type, first find out what the Internal Name of the column is. You can do this on the list settings page by clicking on a column name to edit it. In the URL look for a parameter called “Field.” The Internal Name of the column will be after the “=” sign. The Full Name column, for example, has an internal name of “FullName” with no spaces.

Delete the column, then create a new column and enter “FullName” (no spaces) as the new Column name, and select “Person or Group” for the column type. At the bottom of the page, select “Name (with presence)” in the Show field drop-down and click OK to save the new column.

Now that the new column is created, edit it again and add a space in the column name. This will keep the Internal Name the same (“FullName”), but will change the Display Name to “Full Name” with a space. If we had created the new column and called it “Full Name” with a space to begin with, the Internal Name would have been “Full_x0020_Name” which wouldn’t match the original column’s internal name (SharePoint converts spaces in column names to “_x0020_” when new columns are created).
 to the new column name(s)")
Do this for all other columns that you wish to change to a Person or Group type (simply change the Show field drop-down to show the appropriate information). I recommend changing the following at a minimum if you’re using MOSS 2007 or later, because all of this information should be in Active Directory:
| Column Display Name | Internal Name | Show field Selection |
|---|---|---|
| E-mail Address | Work e-mail | |
| Job Title | JobTitle | Title |
| Business Phone | WorkPhone | Work phone |
I also changed the column order so the new columns are not at the bottom of the EditForm.aspx and DispForm.aspx pages.

Now it’s simply a matter of entering each person in the department into the Contacts list. This may take a while initially, but once it’s set up it only takes a few seconds to add or remove personnel from the list in the future.
Creating the Data View Web Part
The next step is to create the Data View Web Part (DVWP) that will build the nested lists of contacts. Create a new blank web part page on your site called “OrgChart.aspx.” Open the page in SharePoint Designer (you may need to detach the page from its layout), click on an empty web part zone (you’ll need to be in Design or Split view mode), and go to Data View > Insert Data View… to add a new DVWP. In the Data Source Library pane on the right, click on the Contacts list and select “Show Data”.

Now the Data Source Details pane will be visible. Select just one of the fields; at this point it doesn’t matter, so I went with the Last Name field. Now choose to insert the selected field as a Multiple Item View. The DVWP should now be displaying the last names of everyone in the Contacts list.

Hover over the DVWP and click on the small white box with the right-arrow that appears in the top-right corner of the DVWP (this is called the “Common Data View Tasks” menu). From here we need to set a few options. First, click on “Paging” and make sure that “Display all items” is selected.

Then click on “Change Layout…” and select the bulleted list layout. This would be a good time to save the page as well.

Now let’s tidy up the XSLT that SP Designer generates and remove any SharePoint-specific HTML as-needed. Switch to code view and find the <XSL> tag inside the DVWP. Right-click on the tag and select “Select Tag” to highlight the entire XSL style sheet. Now press repeatedly until all of the indentations are gone from the XSLT.

We’re going to be working with the XSL templates quite a bit, so first find each <xsl:template>…</xsl:template> and add an extra blank line before and after each template (i.e. add a blank line before <xsl:template> and after </xsl:template>). I also prefer to re-indent the XSL templates by hand to show nested elements better (use the key, not the ) so my XSL style sheet looks something like this:
<XSL>
<xsl:stylesheet xmlns:x="http://www.w3.org/2001/XMLSchema" xmlns:d="http://schemas.microsoft.com/sharepoint/dsp" version="1.0" exclude-result-prefixes="xsl msxsl ddwrt" xmlns:ddwrt="http://schemas.microsoft.com/WebParts/v2/DataView/runtime" xmlns:asp="http://schemas.microsoft.com/ASPNET/20" xmlns:__designer="http://schemas.microsoft.com/WebParts/v2/DataView/designer" xmlns:xsl="http://www.w3.org/1999/XSL/Transform" xmlns:msxsl="urn:schemas-microsoft-com:xslt" xmlns:SharePoint="Microsoft.SharePoint.WebControls" xmlns:ddwrt2="urn:frontpage:internal">
<xsl:output method="html" indent="no"/>
<xsl:decimal-format NaN=""/>
<xsl:param name="dvt_apos">'</xsl:param>
<xsl:variable name="dvt_1_automode">0</xsl:variable>

<xsl:template match="/" xmlns:x="http://www.w3.org/2001/XMLSchema" xmlns:d="http://schemas.microsoft.com/sharepoint/dsp" xmlns:asp="http://schemas.microsoft.com/ASPNET/20" xmlns:__designer="http://schemas.microsoft.com/WebParts/v2/DataView/designer" xmlns:SharePoint="Microsoft.SharePoint.WebControls">
	<xsl:call-template name="dvt_1"/>
</xsl:template>

<xsl:template name="dvt_1">
	<xsl:variable name="dvt_StyleName">BulTitl</xsl:variable>
	<xsl:variable name="Rows" select="/dsQueryResponse/Rows/Row" />
	<ul>
		<xsl:call-template name="dvt_1.body">
			<xsl:with-param name="Rows" select="$Rows" />
		</xsl:call-template>
	</ul>
</xsl:template>

<xsl:template name="dvt_1.body">
	<xsl:param name="Rows" />
	<xsl:for-each select="$Rows">
		<xsl:call-template name="dvt_1.rowview" />
	</xsl:for-each>
</xsl:template>

<xsl:template name="dvt_1.rowview">
	<li class="ms-vb">
		<xsl:value-of select="@Title" />
		<xsl:if test="$dvt_1_automode = '1'" ddwrt:cf_ignore="1">
			<br /><span ddwrt:amkeyfield="ID" ddwrt:amkeyvalue="ddwrt:EscapeDelims(string(@ID))" ddwrt:ammode="view" />
		</xsl:if>
	</li>
</xsl:template>

</xsl:stylesheet>
</XSL>
Now we can see the code a bit easier. Look for <ul> and change it to <ul id="orgchart">, then find <li class="ms-vb"> in the “dvt_1.rowview” template and remove the class attribute so it’s just <li>. This would be a good time to save the page now that we’ve gone to the trouble of reformatting the code and removing the SharePoint-specific class from the XSLT.
Parameters
I set up my org chart so that it uses two URL query string parameters. The first is “TopLevel” to determine which person to start the org chart with. For example, if the URL were OrgChart.aspx?TopLevel=Josh%20McCarty then the org chart would start with me at the top. This makes the XSLT re-usable to show team-specific charts (by using a team manager as the “TopLevel”) or department-wide charts (by using the Director/VP/etc. of the department as the “TopLevel”). To create this parameter, switch back to design view and open the Common Data View Tasks menu, then click on “Parameters…”
To create the parameter, click on the button and type “TopLevel” as the Name. Select “Query String” as the Parameter Source, and enter “TopLevel” again as the Query String Variable. The Default Value field can be left blank, or it can be set to the head of the department (this will need to be manually updated if that person leaves the department). Click to create the new parameter.

The second parameter I use is “Levels” to determine how many levels deep the org chart should go. For example, if the URL were OrgChart.aspx?TopLevel=Josh%20McCarty&Levels=3 then the org chart would show three levels of subordinates below me (if only I were that high up the ladder!). Create the “Levels” parameter using the same method as the “TopLevel” parameter, but in this case I would specify a default value so the org chart never shows just one person. I used 10. This would be another good time to save the page.
How This All Works
Before we dive into the XSLT and start making further changes, I want to explain how this is going to work. This is the basic logic that the XSLT will use:
- Select the contact whose @FullName matches the value in the “TopLevel” query string parameter, then display that contact in the <li> of the unordered list.
- Create a nested <ul> within the <li> of the top level contact.
- Select all of the contacts whose @Supervisor column matches the @FullName of the top level contact, then display those contacts as <li>’s of the nested <ul>.
- Create nested <ul>’s for each of the nested <li>’s of the second level contacts.
- Select all of the contacts whose @Supervisor column matches the @FullName of the second level contacts, then display those contacts as <li>’s of the second nested <ul>’s.
- Repeat until the level specified in the “Levels” parameter is reached or until there are no more contacts.
Because we are going to be repeating the same process, we can use a recursive XSL template. For each contact, the template will call itself again to display the next level of contacts until there are no more people below the previous contact. It will do this independently on each branch of the org chart, so it will always follow the branches to their lowest level (or until they reach the number of levels specified by the “Levels” parameter in the query string).
Creating the XSLT
Switch back to code view in SP Designer and find the “dvt_1.rowview” template. Below this we are going to create a new “contact_details” template that will display details about each contact in the org chart. We’ll call this template each time we need to display a contact on the org chart. Let’s keep it simple for right now while we’re still developing. This will display just the name (with presence) of the contact:
<xsl:template name="contact_details">
<xsl:param name="Rows" />
<xsl:param name="FullName" />
<xsl:for-each select="$Rows[substring-before(substring-after(substring-after(@FullName, '?ID='), '>'), '<') = $FullName]">
<xsl:value-of select="@FullName" disable-output-escaping="yes" />
</xsl:for-each>
</xsl:template>Notice that <xsl:for-each> has an XPath expression. This is used to select the contact whose @FullName column matches the $FullName parameter that is passed whenever this template is called. Because this column includes presence information, we need to use the substring method to strip out the HTML and get to the raw text of the @FullName column in order to compare it to $FullName. In our “dvt_1.body” and “dvt_1.rowview” templates we are going to use <xsl:call-template> to call the “contact_details” template and pass the $FullName parameter to it.
Now find the “dvt_1.body” template. Modify it by adding a slightly different XPath expression to the select attribute of <xsl:for-each>:
<xsl:for-each select="$Rows[substring-before(substring-after(substring-after(@FullName, '?ID='), '>'), '<') = $TopLevel]">This will filter all of the people in our Contacts list (the “$Rows”) to select the contact whose @FullName value matches the $TopLevel parameter in the query string. We also need to create a variable to track the current level of the org chart so we can test for when the “Levels” parameter from the query string is satisfied. Do this by adding <xsl:variable select="number(0)" /> after <xsl:for-each>. This will set the top level of the org chart to zero (use the “number” method to set the variable to a number value instead of a text string).
To display this contact in the org chart, create a <li> element inside <xsl:for-each> (after the variable we just created). Inside that <li> element, call the “contact_details” template with the Rows and FullName parameters (again use XPath for the FullName to strip out the presence information):
<xsl:template name="dvt_1.body">
<xsl:param name="Rows" />
<xsl:for-each select="$Rows[substring-before(substring-after(substring-after(@FullName, '?ID='), '>'), '<') = $TopLevel]">
<xsl:variable name="CurLevel" select="number(0)" />
<li>
<xsl:call-template name="contact_details">
<xsl:with-param name="Rows" select="$Rows" />
<xsl:with-param name="FullName" select="substring-before(substring-after(substring-after(@FullName, '?ID='), '>'), '<')" />
</xsl:call-template>
<xsl:call-template name="dvt_1.rowview" />
</li>
</xsl:for-each>
</xsl:template>After calling the “contact_details” template, the <li> element will call our “dvt_1.rowview” template to display all of the contacts below the top level. This is where we need to filter the second level of the org chart to select only the contacts whose @Supervisor column matches the @FullName column of the top level contact. We can accomplish this by creating a Supervisor parameter, setting its value to use the @FullName of the top level contact, and passing that value to the “dvt_1.rowview” template. We also need to pass the $CurLevel variable so the additional levels of the org chart can test for when the “Levels” parameter from the query string is satisfied:
<xsl:template name="dvt_1.body">
<xsl:param name="Rows" />
<xsl:for-each select="$Rows[substring-before(substring-after(substring-after(@FullName, '?ID='), '>'), '<') = $TopLevel]">
<xsl:variable name="CurLevel" select="number(0)" />
<li>
<xsl:call-template name="contact_details">
<xsl:with-param name="Rows" select="$Rows" />
<xsl:with-param name="FullName" select="substring-before(substring-after(substring-after(@FullName, '?ID='), '>'), '<')" />
</xsl:call-template>
<xsl:call-template name="dvt_1.rowview">
<xsl:with-param name="Rows" select="$Rows" />
<xsl:with-param name="CurLevel" select="$CurLevel" />
<xsl:with-param name="Supervisor" select="substring-before(substring-after(substring-after(@FullName, '?ID='), '>'), '<')" />
</xsl:call-template>
</li>
</xsl:for-each>
</xsl:template>Note: Because we are using a query string parameter to determine which contact is at the top of the org chart, the design view in SP Designer will never show any contacts (unless you specified a default value for the “TopLevel” parameter), so don’t worry if you don’t see anything. You can check progress any time by saving the page and opening it in a browser and including the query string parameters.
To create the second level of the org chart, edit the “dvt_1.rowview” template to receive the $Rows and $Supervisor parameters. Then wrap a <ul> around an <xsl:for-each> with an XPath expression to select only the contacts whose @Supervisor column matches the $Supervisor parameter. Include a <li> inside <xsl:for-each> and call the “contact_details” template:
<xsl:template name="dvt_1.rowview">
<xsl:param name="Rows" />
<xsl:param name="Supervisor" />
<ul>
<xsl:for-each select="$Rows[substring-before(substring-after(substring-after(@Supervisor, '?ID='), '>'), '<') = $Supervisor]">
<li>
<xsl:call-template name="contact_details">
<xsl:with-param name="Rows" select="$Rows" />
<xsl:with-param name="FullName" select="substring-before(substring-after(substring-after(@FullName, '?ID='), '>'), '<')" />
</xsl:call-template>
</li>
</xsl:for-each>
</ul>
</xsl:template>Now we need to modify the “dvt_1.rowview” template so it calls itself (i.e. make it recursive) until the “Levels” parameter from the query string is satisfied. To do this, first add <xsl:param name="CurLevel" /> so the $CurLevel parameter is received from the “dvt_1.body” template, then create a new variable called “LevelTest” to set the second level to $CurLevel + 1 so we can increment the level of the org chart:
<xsl:template name="dvt_1.rowview">
<xsl:param name="Rows" />
<xsl:param name="Supervisor" />
<xsl:param name="CurLevel" />
<xsl:variable name="LevelTest" select="number($CurLevel + 1)" />
<ul>
<xsl:for-each select="$Rows[substring-before(substring-after(substring-after(@Supervisor, '?ID='), '>'), '<') = $Supervisor]">
<li>
<xsl:call-template name="contact_details">
<xsl:with-param name="Rows" select="$Rows" />
<xsl:with-param name="FullName" select="substring-before(substring-after(substring-after(@FullName, '?ID='), '>'), '<')" />
</xsl:call-template>
</li>
</xsl:for-each>
</ul>
</xsl:template>Next we need to test for the value of $LevelTest and only display the contacts if $LevelTest is less than or equal to the “Levels” parameter in the query string. Add this <xsl:if> around the <ul> element:
<xsl:template name="dvt_1.rowview">
<xsl:param name="Rows" />
<xsl:param name="Supervisor" />
<xsl:param name="CurLevel" />
<xsl:variable name="LevelTest" select="number($CurLevel + 1)" />
<xsl:if test="($LevelTest <= number($Levels))">
<ul>
<xsl:for-each select="$Rows[substring-before(substring-after(substring-after(@Supervisor, '?ID='), '>'), '<') = $Supervisor]">
<li>
<xsl:call-template name="contact_details">
<xsl:with-param name="Rows" select="$Rows" />
<xsl:with-param name="FullName" select="substring-before(substring-after(substring-after(@FullName, '?ID='), '>'), '<')" />
</xsl:call-template>
</li>
</xsl:for-each>
</ul>
</xsl:if>
</xsl:template>We don’t want to display anything if there are no contacts that match the $Supervisor parameter, so we need to nest another <xsl:if> inside the <xsl:if> for the $LevelTest parameter and test if any contacts exist whose @FullName column matches the $Supervisor parameter:
<xsl:template name="dvt_1.rowview">
<xsl:param name="Rows" />
<xsl:param name="Supervisor" />
<xsl:param name="CurLevel" />
<xsl:variable name="LevelTest" select="number($CurLevel + 1)" />
<xsl:if test="($LevelTest <= number($Levels))">
<xsl:if test="$Rows[substring-before(substring-after(substring-after(@Supervisor, '?ID='), '>'), '<') = $Supervisor]">
<ul>
<xsl:for-each select="$Rows[substring-before(substring-after(substring-after(@Supervisor, '?ID='), '>'), '<') = $Supervisor]">
<li>
<xsl:call-template name="contact_details">
<xsl:with-param name="Rows" select="$Rows" />
<xsl:with-param name="FullName" select="substring-before(substring-after(substring-after(@FullName, '?ID='), '>'), '<')" />
</xsl:call-template>
</li>
</xsl:for-each>
</ul>
</xsl:if>
</xsl:if>
</xsl:template>Finally we need to make the template recursive by calling itself. Call the “dvt_1.rowview” template after calling the “contact_details” template, and pass all the same parameters that we used when calling “dvt_1.rowview” from the “dvt_1.body” template, except use $LevelTest when selecting the “CurLevel” parameter instead of using the number zero. This means that when “dvt_1.rowview” is called again, it will continue to increment the value of $CurLevel by +1 each time, allowing the template keep calling itself until it satisfies the “Levels” parameter in the query string:
<xsl:template name="dvt_1.rowview">
<xsl:param name="Rows" />
<xsl:param name="Supervisor" />
<xsl:param name="CurLevel" />
<xsl:variable name="LevelTest" select="number($CurLevel + 1)" />
<xsl:if test="($LevelTest <= number($Levels))">
<xsl:if test="$Rows[substring-before(substring-after(substring-after(@Supervisor, '?ID='), '>'), '<') = $Supervisor]">
<ul>
<xsl:for-each select="$Rows[substring-before(substring-after(substring-after(@Supervisor, '?ID='), '>'), '<') = $Supervisor]">
<li>
<xsl:call-template name="contact_details">
<xsl:with-param name="Rows" select="$Rows" />
<xsl:with-param name="FullName" select="substring-before(substring-after(substring-after(@FullName, '?ID='), '>'), '<')" />
</xsl:call-template>
<xsl:call-template name="dvt_1.rowview">
<xsl:with-param name="Rows" select="$Rows" />
<xsl:with-param name="CurLevel" select="$LevelTest" />
<xsl:with-param name="Supervisor" select="substring-before(substring-after(substring-after(@FullName, '?ID='), '>'), '<')" />
</xsl:call-template>
</li>
</xsl:for-each>
</ul>
</xsl:if>
</xsl:if>
</xsl:template>Save the page, then open it in your browser and take a look (don’t forget to use include the query string in your URL). You should see a bulleted list of contacts, grouped according to supervisor. Try changing the “Levels” parameter in the query string to see the org chart change in depth.
Note: A value of “0” for the “Levels” parameter will show just the person in the “TopLevel” parameter. A value of “1” will show one level below the person at the top; a value of “2” will show two levels below the person at the top, and so on.

Now that our nested lists are working, let’s add additional information to the “contact_details” template. All of our changes will take place inside <xsl:for-each>. Go ahead and add any additional columns that you want displayed. For example, if you wanted to display name, job title, work phone, and email (with a mailto link) your template might look something like this:
<xsl:template name="contact_details">
<xsl:param name="Rows" />
<xsl:param name="FullName" />
<xsl:for-each select="$Rows[substring-before(substring-after(substring-after(@FullName, '?ID='), '>'), '<') = $FullName]">
<xsl:value-of select="@FullName" disable-output-escaping="yes" /><br />
<xsl:value-of select="substring-before(substring-after(substring-after(@JobTitle, '?ID='), '>'), '<')" /><br />
<xsl:value-of select="substring-before(substring-after(substring-after(@WorkPhone, '?ID='), '>'), '<')" /><br />
<a href="mailto:{substring-before(substring-after(substring-after(@Email, '?ID='), '>'), '<')}"><xsl:value-of select="substring-before(substring-after(substring-after(@Email, '?ID='), '>'), '<')" /></a>
</xsl:for-each>
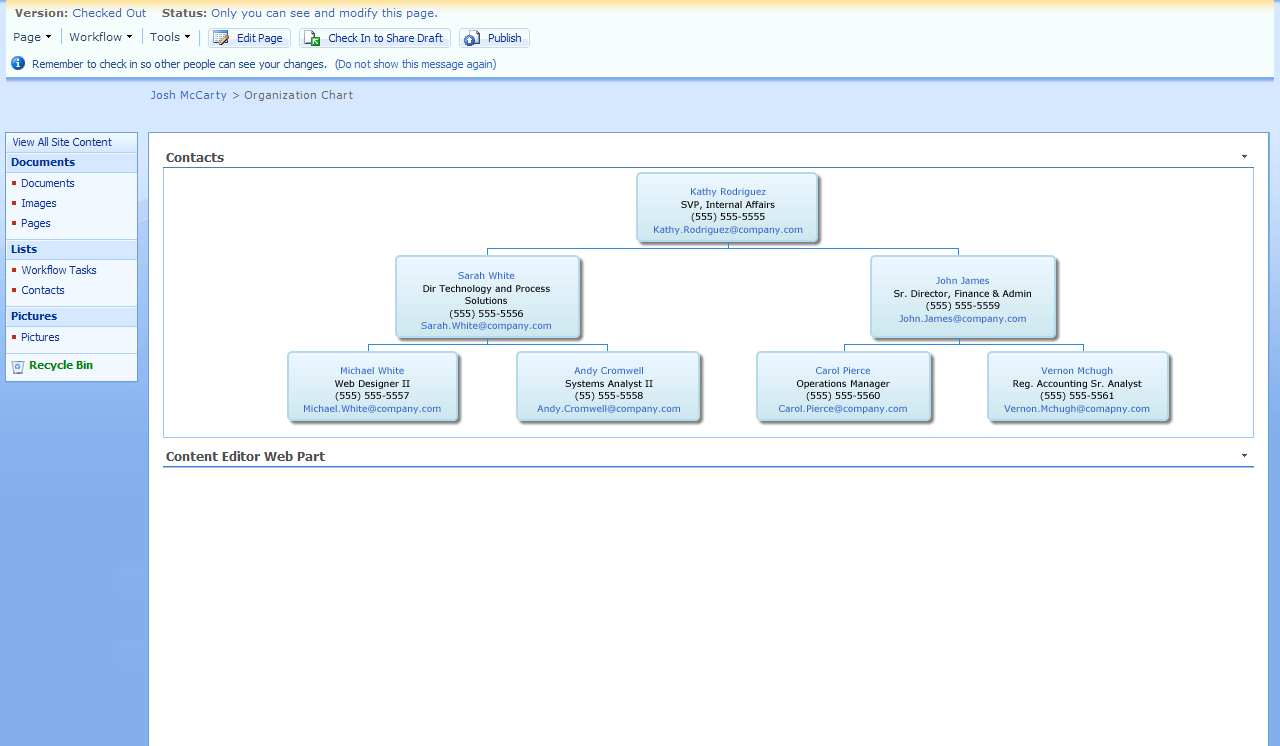
</xsl:template>Note how we took a substring of most of the columns. By default, all columns that are a “Person or Group” type include presence information. We don’t need that displayed more than once, so we can remove it from all columns except the @FullName column. Also be sure to include the disable-output-escaping="yes" attribute to the @FullName column, otherwise the actual HTML code will be output as text on the page. Save the page and take a look in your browser. The result will look like this:

The Data View Web Part is now completed. Here is the entire XSL style sheet if you want to copy and paste this into your DVWP:
<Xsl>
<xsl:stylesheet xmlns:x="http://www.w3.org/2001/XMLSchema" xmlns:d="http://schemas.microsoft.com/sharepoint/dsp" version="1.0" exclude-result-prefixes="xsl msxsl ddwrt" xmlns:ddwrt="http://schemas.microsoft.com/WebParts/v2/DataView/runtime" xmlns:asp="http://schemas.microsoft.com/ASPNET/20" xmlns:__designer="http://schemas.microsoft.com/WebParts/v2/DataView/designer" xmlns:xsl="http://www.w3.org/1999/XSL/Transform" xmlns:msxsl="urn:schemas-microsoft-com:xslt" xmlns:SharePoint="Microsoft.SharePoint.WebControls" xmlns:ddwrt2="urn:frontpage:internal">
<xsl:output method="html" indent="no"/>
<xsl:decimal-format NaN=""/>
<xsl:param name="dvt_apos">'</xsl:param>
<xsl:param name="ListID">47FC6EED-1305-4425-B6BF-3818D6298ECE</xsl:param>
<xsl:param name="TopLevel" />
<xsl:param name="Levels" />
<xsl:variable name="dvt_1_automode">0</xsl:variable>
<xsl:template match="/" xmlns:x="http://www.w3.org/2001/XMLSchema" xmlns:d="http://schemas.microsoft.com/sharepoint/dsp" xmlns:asp="http://schemas.microsoft.com/ASPNET/20" xmlns:__designer="http://schemas.microsoft.com/WebParts/v2/DataView/designer" xmlns:SharePoint="Microsoft.SharePoint.WebControls">
<xsl:call-template name="dvt_1"/>
</xsl:template>
<xsl:template name="dvt_1">
<xsl:variable name="dvt_StyleName">BulTitl</xsl:variable>
<xsl:variable name="Rows" select="/dsQueryResponse/Rows/Row" />
<ul id="orgchart">
<xsl:call-template name="dvt_1.body">
<xsl:with-param name="Rows" select="$Rows" />
</xsl:call-template>
</ul>
</xsl:template>
<xsl:template name="dvt_1.body">
<xsl:param name="Rows" />
<xsl:for-each select="$Rows[substring-before(substring-after(substring-after(@FullName, '?ID='), '>'), '<') = $TopLevel]">
<xsl:variable name="CurLevel" select="number(0)" />
<li>
<xsl:call-template name="contact_details">
<xsl:with-param name="Rows" select="$Rows" />
<xsl:with-param name="CurLevel" select="$CurLevel" />
<xsl:with-param name="FullName" select="substring-before(substring-after(substring-after(@FullName, '?ID='), '>'), '<')" />
</xsl:call-template>
<xsl:call-template name="dvt_1.rowview">
<xsl:with-param name="Rows" select="$Rows" />
<xsl:with-param name="CurLevel" select="$CurLevel" />
<xsl:with-param name="Supervisor" select="substring-before(substring-after(substring-after(@FullName, '?ID='), '>'), '<')" />
</xsl:call-template>
</li>
</xsl:for-each>
</xsl:template>
<xsl:template name="dvt_1.rowview">
<xsl:param name="Rows" />
<xsl:param name="CurLevel" />
<xsl:param name="Supervisor" />
<xsl:variable name="LevelTest" select="number($CurLevel + 1)" />
<xsl:if test="($LevelTest <= number($Levels))">
<xsl:if test="$Rows[substring-before(substring-after(substring-after(@Supervisor, '?ID='), '>'), '<') = $Supervisor]">
<ul>
<xsl:for-each select="$Rows[substring-before(substring-after(substring-after(@Supervisor, '?ID='), '>'), '<') = $Supervisor]">
<li>
<xsl:call-template name="contact_details">
<xsl:with-param name="Rows" select="$Rows" />
<xsl:with-param name="FullName" select="substring-before(substring-after(substring-after(@FullName, '?ID='), '>'), '<')" />
</xsl:call-template>
<xsl:call-template name="dvt_1.rowview">
<xsl:with-param name="Rows" select="$Rows" />
<xsl:with-param name="CurLevel" select="$LevelTest" />
<xsl:with-param name="Supervisor" select="substring-before(substring-after(substring-after(@FullName, '?ID='), '>'), '<')" />
</xsl:call-template>
</li>
</xsl:for-each>
</ul>
</xsl:if>
</xsl:if>
</xsl:template>
<xsl:template name="contact_details">
<xsl:param name="Rows" />
<xsl:param name="CurLevel" />
<xsl:param name="FullName" />
<xsl:for-each select="$Rows[substring-before(substring-after(substring-after(@FullName, '?ID='), '>'), '<') = $FullName]">
<div>
<xsl:value-of select="@FullName" disable-output-escaping="yes" /><br />
<xsl:value-of select="substring-before(substring-after(substring-after(@JobTitle, '?ID='), '>'), '<')" /><br />
<xsl:value-of select="substring-before(substring-after(substring-after(@WorkPhone, '?ID='), '>'), '<')" /><br />
<a href="mailto:{substring-before(substring-after(substring-after(@Email, '?ID='), '>'), '<')}"><xsl:value-of select="substring-before(substring-after(substring-after(@Email, '?ID='), '>'), '<')" /></a>
</div>
</xsl:for-each>
</xsl:template>
</xsl:stylesheet>
</Xsl>Adding Scripts to Generate the Org Chart
The next step is to load the scripts onto the page that generate the org chart. Minimize your browser and go back to SP Designer and switch to design view. Insert a Content Editor Web Part (CEWP) on the page, switch to code view, and find the content section of the CEWP:
<Content xmlns="http://schemas.microsoft.com/WebPart/v2/ContentEditor"><![CDATA[]]></Content>Create a few blank lines between the “[]” brackets so you have some room to work:
<Content xmlns="http://schemas.microsoft.com/WebPart/v2/ContentEditor">
	<![CDATA[

	]]>
</Content>
All of the content in a CEWP goes between those two brackets. Add the following scripts inside the CEWP, making sure to change the source attribute accordingly (I’m loading jQuery and the org chart visualization from Google for development purposes; you may want to save a copy of the scripts to your server and load them from there when the org chart is in production; note the Nested List to Google Org Chart jQuery plugin must be saved to your server because it’s not hosted anywhere else, so I have it in a “webresources” document library):
<script type="text/javascript" src="http://ajax.googleapis.com/ajax/libs/jquery/1.4.2/jquery.min.js"></script>This loads the jQuery library.
<script type='text/javascript' src='http://www.google.com/jsapi'></script>This loads the Google charts API.
<script type="text/javascript">
	google.load('visualization', '1', {packages:['orgchart']});
</script>
This loads the org chart visualization.
<script type="text/javascript" src="http://servername/site/WebResources/jquery.g_orgchart.js"></script>This loads the Nested List to Google Org Chart jQuery plugin from my “webresources” library.
<script type="text/javascript">
	$(document).ready(function(){
		$("#orgchart").g_orgchart({ 'size' : 'small' , 'allowCollapse' : 'true' });
	});
</script>
This tells the Org Chart jQuery plugin which nested list to use for the org chart and specifies any options to use for the org chart such as size.
The entire CEWP content section should look like this:
<Content xmlns="http://schemas.microsoft.com/WebPart/v2/ContentEditor"><![CDATA[
	<script type="text/javascript" src="http://ajax.googleapis.com/ajax/libs/jquery/1.4.2/jquery.min.js"></script>
	<script type='text/javascript' src='http://www.google.com/jsapi'></script>
	<script type="text/javascript">
		google.load('visualization', '1', {packages:['orgchart']});
	</script>
	<script type="text/javascript" src="http://newsource/extaffairs/WebResources/jquery.g_orgchart.js"></script>
	<script type="text/javascript">
		$(document).ready(function(){
			$("#orgchart").g_orgchart({ 'size' : 'small' , 'allowCollapse' : 'true' });
		});
	</script>
]]></Content>
Save the page and view it in your browser. You should now have an org chart!

Most likely you’re viewing the org chart in Internet Explorer, so the actual nodes for each person will not look very appealing (white background with a light-blue border). If you view the org chart in a browser with CSS3 support (Firefox, Chrome, Safari, etc.) you should see a much nicer version of the chart with rounded corners, a background color gradient, and drop-shadows:

To make the chart a little more visually appealing in Internet Explorer, add the following CSS below the scripts in the CEWP to give the nodes a background color:
<style type="text/css">
.google-visualization-orgchart-node {
	background-color: #edf7ff;
}
.google-visualization-orgchart-nodesel {
	background-color: #fff7ae;
}
</style>
There, that looks better!

Internet Explorer also renders the nodes in different sizes; I assume it’s just the way IE handles tables (the org chart is actually created using table cells and cell borders).
From this point on you can customize the org chart even further. For example, by altering the “contact_details” template and using some additional CSS and JavaScript, we can create pop-up windows that display additional information about the user when clicked.
An Alternative Org Chart with No JavaScript
If you’d prefer not to use any JavaScript for the org chart, you can get a fair approximation of the org chart (minus the connecting lines) by using just CSS in the CEWP:
<style type="text/css">
#orgChart {
	font-size: 10px;
	font-family: arial, helvetica, sans-serif;
	line-height: 1.1em;
	text-align: center;
}
#orgChart, #orgChart ul {
	float: left;
	list-style-type: none;
	margin: 5px 0 0 0;
	padding: 0;
	text-align: center;
}
#orgChart li {
	display: inline;
	float: left;
	margin: 10px 5px;
	padding: 0;
}
#orgChart li div {
	-webkit-box-shadow: rgba(0, 0, 0, 0.496094) 3px 3px 3px;
	background: -webkit-gradient(linear, 0% 0%, 0% 100%, from(#EDF7FF), to(#CDE7EE));
	background-color: #EDF7FF;
	border: 2px solid #CDE7EE;
	border-radius: 5px;
	cursor: default;
	display: block;
	height: 60px;
	width: 150px;
	margin: 0 auto;
	padding: 5px;
}
</style>
Note: Using the CSS-only method will cause your org chart nodes to wrap below each other if the width of the page is too small to include all of the nodes side-by-side. You can avoid this by specifying a width for #orgChart that is large enough to include all org chart nodes.
That just about covers everything I can think of for creating an org chart in MOSS 2007 without deploying any custom web part code. If you come up with any cool ways to enhance the org chart (like adding functionality with the “contact_details” template), be sure to let me know!
Comments
Comments are closed